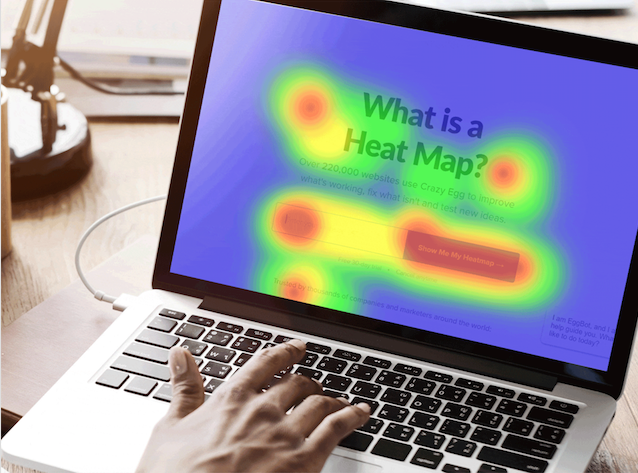
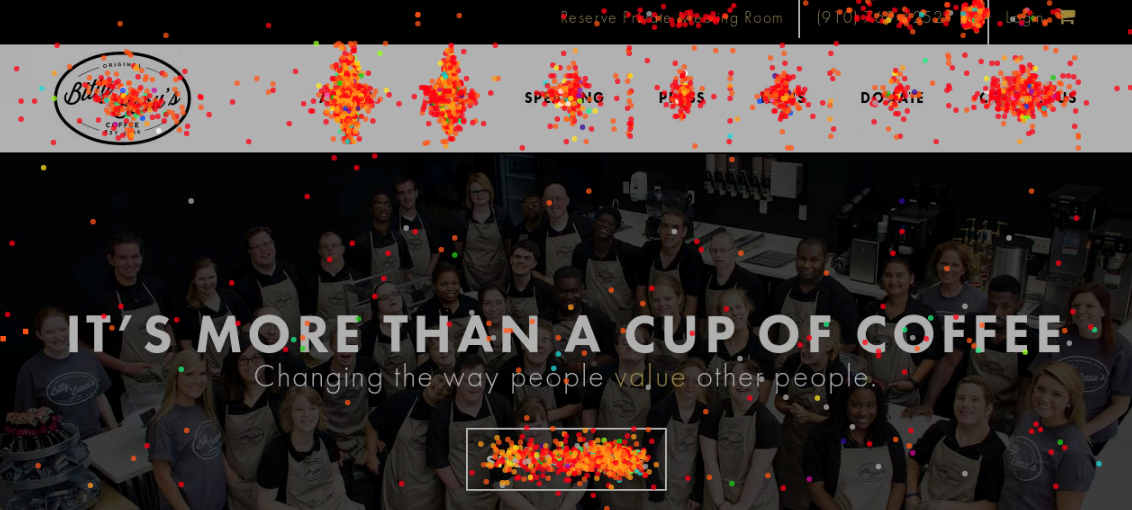
Curious what actions users are taking – or rather, not taking – on your website? Questioning what content they’re stopping to read and what they’re scrolling right on past?
All these uncertainties and more can be answered with heat maps – a useful and easily understood data visualization tool we use every day.
At WDC, we consider heat maps our best friend when it comes to understanding user behavior across your website. Using a warm-to-cool color spectrum, the visual storytelling tool highlights which areas of your website garner the most attention, and which ones don’t quite make the cut.
Various types of heat maps show us where users are clicking, how far they scroll on a page, and more, in a way that's simple to interpret and translate into future design, development and marketing decisions.

YMCA Eyes Growth With Plans For New, Expanded Facilities
Emma Dill
-
Apr 23, 2024
|
|
Burns, Redenbaugh Promoted At Coastal Horizons
Staff Reports
-
Apr 23, 2024
|
|
Cold Storage Developer Sets Near-port Facility Completion Date
Audrey Elsberry
-
Apr 24, 2024
|
|
Wilmington Financial Firm Transitions To Wells Fargo's Independent Brokerage Arm
Audrey Elsberry
-
Apr 24, 2024
|
|
Krug Joins Infinity Acupuncture
Staff Reports
-
Apr 23, 2024
|
|

W.R. Rayson is a family-owned manufacturer and converter of disposable paper products used in the dental, medical laboratory and beauty indu...

Baristas are incorporating craft cocktail techniques into show-stopping coffee drinks, and bartenders are mixing espresso and coffee liqueur...

Michelle Penczak, who lives in Pender County, built her own solution with Squared Away, her company that now employs over 400 virtual assist...

The 2024 WilmingtonBiz: Book on Business is an annual publication showcasing the Wilmington region as a center of business.