This Insights article was contributed by Edward Graham, Professor of Finance at UNCW's Cameron School Business.
The U.S. residential real estate market has been a leading topic in the news over the last decade or more.
With increasing mortgage delinquencies in late 2007 and the bursting of the real estate bubble soon thereafter, home values across the U.S. began an historic decline.
The Case-Shiller Home Price Index (Table I below) captures both the escalation in home values between 2000 and 2006, the correction in house prices as the housing bubble burst, and the recovery, on average, of the housing market across the U.S. by mid-2018. Prices, on average across the U.S. more than doubled in the years ending in the spring of 2007.
In the Cape Fear Region, using an admittedly informal but representative “index” created using home sales data provided by the Wilmington Regional Association of Realtors (WRAR), prices increased over 75 percent in the years ending in the spring of 2007.
Prices then fell across the local market but have since recovered. Few expected the recovery of the real estate market, in either Southeastern North Carolina or across the nation, to be as rapid as it has been.
Reflected in the data in Table I, declinations in house prices were observed across the U.S. and Cape Fear region between 2007 and 2012. Since then, prices in most neighborhoods across the Wilmington area have reached or surpassed prior peaks in 2007.
Discussed below, this pattern has proven a quandary for the new student in real estate investments, as he or she examines local “opportunities.” Real estate is once again “expensive,” and finding “deals” with assured favorable returns is becoming more complicated.
Table I– Implied Housing Index for the Cape Fear Region: January 2000 – September 2017
(The Cape Fear Regional Index is subject to reporting error, and small sample bias.)
Month
Year |
Cape Fear Regional Index*, ** |
20-City Index*** |
| January 2000 |
100.00 |
100.59 |
| March 2001 |
110.88 |
115.09 |
| March 2002 |
109.08 |
123.31 |
| March 2003 |
112.11 |
138.36 |
| March 2004 |
123.12 |
156.88 |
| March 2005 |
135.52 |
183.12 |
| March 2006 |
152.48 |
206.03 |
| March 2007 |
177.21 |
203.78 |
| March 2008 |
165.09 |
174.90 |
| March 2009 |
143.74 |
143.15 |
| March 2010 |
138.77 |
146.85 |
| March 2011 |
147.84 |
141.23 |
| March 2012 |
138.52 |
137.37 |
| February 2013 |
143.74 |
149.80 |
| May 2013 |
156.02 |
156.06 |
| April 2014 |
163.49 |
168.73 |
| March 2015 |
160.99 |
174.98 |
| March 2016 |
164.27 |
184.52 |
| March 2017 |
179.06 |
195.35 |
| June 2017 |
188.91 |
200.43 |
| September 2017 |
187.27 |
203.63 |
| December 2017* |
* |
204.44 |
| March 2018* |
* |
208.50 |
* http://www.wrar.com/home-sales-stats-buyers-and-sellers-menu/resid-mls-stats-buyers-and-sellers-menu.html Changes in available data, as of late 2017, preclude the continuing assembly of this Cape Fear Regional Index.
** Cape Fear Regional Index based upon reported Realtor data, through the third quarter, 2017.
***Index derived from the Case Shiller Index, Standard and Poor’s https://us.spindices.com/indices/real-estate/sp-corelogic-case-shiller-20-city-composite-home-price-nsa-index
How do these data inform real estate investors? From an investor’s or a lender’s viewpoint, home prices
relative to a property’s income have become lofty.
A key metric employed by both real estate lenders and investors (these remarks may not apply directly to the traditional homebuyer) is the capitalization rate or “cap rate.” The cap rate on a real estate investment is simply the property’s net operating income divided by the price paid for the property.
For example, if a newer but modest home in the Ogden area sells for $200,000, and rents for $1,500 per month, it earns $18,000 (12 months x $1,500 per month) per year in potential gross income.
Assume operating expenses (this ignores vacancies and mortgage interest and depreciation taken for tax purposes), such as property taxes, insurance, maintenance and management, total $8,000 per year. The property has a net operating income or NOI (its potential gross income minus expenses) of $18,000 - $8,000 or $10,000. The cap rate on this home is the home’s NOI divided by its value or $10,000/$200,000 = .05 or five percent.
With no financing, that five-percent yield is the return the investor will earn. That cap rate will support very little financing (investment property interest rates are close to or greater than five percent), and the property is a costly prospect for the new real estate investments student.
Several years ago, as suggested by Table I, cap rates – even in the Cape Fear Region – of eight percent or more were not uncommon. Cap rates of 10 percent or more were briefly the norm in many areas.
The real estate investor today needs to be far more patient, more selective, and more willing to accept a lower return than was the case in the riskier times of several years ago.
A confluence of factors has contributed to the “pricey” real estate outcomes being observed today in the Wilmington area, across the
Southeast and across the
nation.
Prices nationwide have increased over seven percent, on average, over the last year, and the inventory, also nationwide, has fallen over 14 percent as of January of this year.
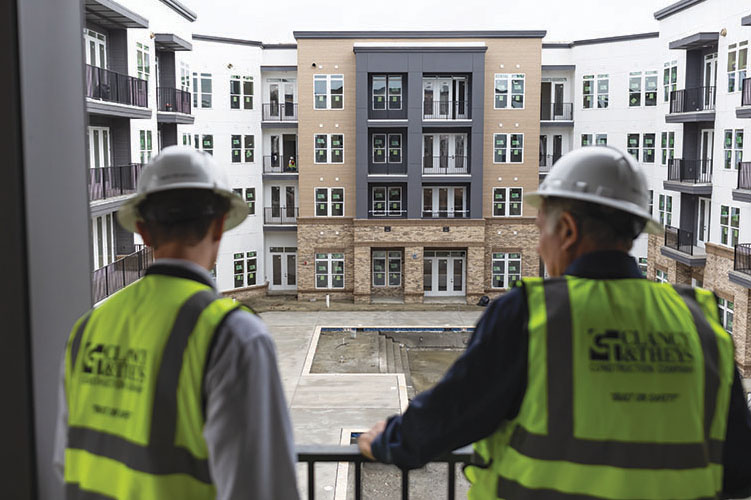
The supply of homes available for sale in the tri-county Wilmington market has fallen over 15 percent in the last year (as of May 2018), and an inventory of less than four months of sales exists for townhomes and condominiums. Some of the incentives for the apartment construction in the area become clearer when this data is considered.
Local Housing Prices And The Prospective Investor
As I teach my real estate investments course in the Cameron School, students discover patterns all too familiar to local real estate professionals.
As a result of a healthy local and national economy, the attractiveness of the Cape Fear Region to folks outside the area, a declining area and nationwide inventory of available homes and the continuing availability of modestly-priced financing, demand outpaced supply and driven prices up.
This seems a favorable time for a homeowner considering selling her home, but the same might have been said a year or two ago when prices then seemed generous yet were lower than today.
Only time will tell with this market!
While the old saying was always: “Location, Location, Location,” the more successful real estate investor might counter, “Timing, Timing, Timing!”
Robert T. Burrus, Jr., Ph.D., is the dean of the Cameron School of Business at the University of North Carolina Wilmington, named in June 2015. Burrus joined the UNCW faculty in 1998. Prior to his current position, Burrus was interim dean, associate dean of undergraduate studies and the chair of the department of economics and finance. Burrus earned a Ph.D. and a master’s degree in economics from the University of Virginia and a bachelor’s degree in mathematical economics from Wake Forest University. The Cameron School of Business has approximately 60 full-time faculty members and 20 administrative and staff members. The AACSB-accredited business school currently enrolls approximately 2,000 undergraduate students in three degree programs and 200 graduate students in four degree programs. The school also houses the prestigious Cameron Executive Network, a group of more than 200 retired and practicing executives that provide one-on-one mentoring for Cameron students. To learn more about the Cameron School of Business, please visit http://csb.uncw.edu/. Questions and comments can be sent to [email protected].